
Great Barrier Reef

Water absorbs a wide range of electromagnetic radiation with rotational transitions and intermolecular vibrations responsible for absorption in the microwave (~1 mm - 10 cm wavelength) and far-infrared (~10 µm - 1 mm), intramolecular vibrational transitions in the infrared (~1 µ- 10 µ) and electronic transitions occurring in the ultraviolet region (< 200 nm).
![]() Absorption and penetration
Absorption and penetration
![]() Absorption spectra of gaseous, liquid and solid water
Absorption spectra of gaseous, liquid and solid water
![]() The vibrational spectra of liquid water
The vibrational spectra of liquid water
![]() The visible and UV spectra of liquid water
The visible and UV spectra of liquid water
![]() The spectrum of the Zundel cation
The spectrum of the Zundel cation
![]() Absorption and penetration
Absorption and penetration
![]() Humidity units
Humidity units
Water is the main absorber of the sunlight in the atmosphere; without it, the Earth would be in a permanent ice-age. The 13 trillion tons of water in the atmosphere (~0.33% by weight; compare CO2 ~0.04% ) is responsible for about 70% of all atmospheric absorption of radiation, mainly in the infrared region where water shows strong absorption. The average relative humidity l of the atmosphere [2474] is about 75% at ground level reducing to about at 45% at 5000 m. See also, water and global warming.
The maximum water vapor in the air

Earth's humidity, March 2015
 from http://earthobservatory.nasa.gov/GlobalMaps/")
The water absorption spectrum is very complex. Water's vapor spectroscopy (including microwave [3176]) has been reported [348a] and recently reviewed [348b]. The water molecule may vibrate in a number of ways. In the gas state, the vibrations [607] involve combinations of symmetric stretch (v1), asymmetric stretch (v3) and bending (v2) of the covalent bonds with absorption intensity (H216O) v1;v2;v3 = 0.07;1.47;1.00 [8]. As shown right, there is significant isotope effects with the frequencies in H2O are higher than those in D2O and T2O; the ratios between H2O, D2O, and T2O being approximately the square root of the D:H or T:H atomic mass ratios. The stretch vibrations of HDO refer to the single bond vibrations, not the combined movements of both bonds. Gas phase rotations [1701] are complex and are combined with these vibrations. The lowest ortho-para transitions are given elsewhere.
Gas |
v1,
cm-1 |
v2,
cm-1 |
v3,
cm-1 |
|---|---|---|---|
H216O |
3657.1 |
1594.7 |
3755.9 |
H217O |
3653.1 |
1591.3 |
3748.3 |
H218O |
3649.7 |
1588.3 |
3741.6 |
HD16O |
2723.7 |
1403.5 |
3707.5 |
| HD17O | (2716.0)* | 1399.7 |
(3701.5)* |
| HD18O | 2709.3 |
1396.3 |
3696.3 |
D216O |
2671.6 |
1178.4 |
2787.7 |
| D217O | (2665.8)* | 1174.0 |
(2772.3)* |
| D218O | 2660.8 |
1170.2 |
2767.5 |
HT16O |
2299.8 |
1332.5 |
3716.6 |
T216O |
2237.2 |
995.4 |
2366.6 |
* estimated
[Back to Top ![]() ]
]
Water vibration modes
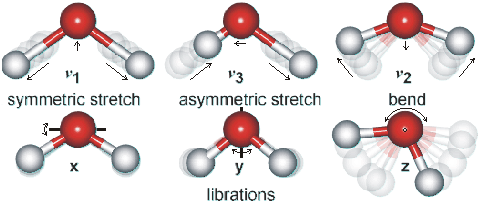
Shown opposite are the main vibrations occurring in liquid water. Rotations in the liquid phase are totally dominated by hydrogen bonding. The movements are animated using the cursor. The dipole moments change in the direction of the movement of the oxygen atoms as shown by the arrows. As the H-atoms are light, the vibrations have large amplitudes that have been wxagerated in the cartoon.
The water molecule has a very small moment of inertia on rotation which gives rise to rich combined vibrational-rotational spectra in the vapor containing tens of thousands to millions of absorption lines. In the liquid, rotations tend to be restricted by hydrogen bonds, giving the librations. Also, spectral lines are broader causing overlap of many of the absorption peaks.
Absorbance of gaseous, liquid and solid water;
mouse over for LDL and HDL

Shown left is a comparison of the gas, liquid and solid spectra of the same amount of H2O [1392]. Mouse over the Figure to show the high (HDL) and low (LDL) density liquid water forms [1738]. j The main stretching band in liquid water is shifted to a lower frequency (v3, 3490 cm-1, and v1, 3280 cm-1 [8]) and the bending frequency increased (v2, 1644 cm-1 [942]) by hydrogen bonding. As seen, increased strength of hydrogen bonding typically shifts the stretch vibration to lower frequencies (red-shift) with greatly increased intensity in the infrared (but not Raman) due to the increased dipoles. Blue-shifting hydrogen bonds are described elsewhere.
[Back to Top ![]() ]
]
Vibration(s)
[942] |
liquid H2O
(25 °C) |
liquid D2O
(25 °C) |
liquid T2O [1848] | ||
|---|---|---|---|---|---|
v,
cm-1 |
ελ, M-1 cm-1 d |
v,
cm-1 |
ελ,
M-1 cm-1 |
v,
cm-1 |
|
| v2 | 1643.5 |
21.65 |
1209.4 |
17.10 |
1024 |
| combination of v2+ libration | 2127.5 |
3.46 |
1555.0 |
1.88 |
|
| v1, v3, and overtone of v2 | 3404.0 e |
100.61 |
2504.0 |
69.68 |
2200 |
Comparative spectra of H2O, D2O and HOD

HDO (50 mole % H2O plus 50 mole % D2O; ~50% HDO, ~25% H2O, ~25% D2O) has maxima at 3415 cm-1, 2495 cm-1 1850 cm-1 and 1450 cm-1 assigned to OH stretch, OD stretch, h combination of v2+ libration and HDO bending respectively [786] (see right for comparative spectra). HTO and DTO (50 mole % mixtures as HDO above) have v2 bend maxima at 1388 cm-1 and 1130 cm-1 respectively [1848]. The Raman spectra of the vibrational peaks has been determined for H2O, D2O and isotopic mixtures, at temperatures from 303 to 573 K [3018]. All the vibrational bands in liquid water are made up from contributions of different components from water molecules in different hydrogen-bonded environments (see, for example, hydrogen bonds); lower frequency components are attributed to water molecules with stronger hydrogen bonds and higher frequency components have weaker hydrogen bonds [2157].
Variations in the environment around each liquid water molecule give rise to considerable line broadening with vibration shifts in a hydrogen-bond-donating water molecule being greater than in a hydrogen-bond accepting molecule but both acting in the same direction [679], and accumulating with the number of hydrogen bonds. The strength of the hydrogen bonding depends on the cooperative/anti-cooperative nature of the surrounding hydrogen bonds with strongest hydrogen bonds giving the lowest vibrational frequencies [852]. Stretching frequency increases about 360 (at 3.1 Å) -1000 (at 2.6 Å) cm-1Å-1 with increasing O····O distance and about 9 cm-1 degree-1 with increasing O-H····O bend [446]. The absorption intensity of these bands is v1;v2;v3 = 0.87;0.33;1.00 [8]. In supercooled water, the spectral peaks are shifted to lower frequencies with a 70 cm-1 shift of the stretch frequency and 30% increase in its intensity between 298 K and 238 K [1065]. Ultimately a stretch peak at 3120 cm-1 dominates, as it also does in amorphous ice ( LDA) [1252]. In hexagonal ice, these bands are shifted further (v1, 3085 cm-1, v2, 1650 cm-1,v3, 3220 cm-1).
Raman spectra, from [2830]
![Raman spectra redrawn from [2830] showing proposed Gaussian peak analysis](Water%20absorption%20spectrum_files/ramanOH.gif "Raman spectra redrawn from [2830] showing proposed Gaussian peak analysis")
The O-H stretch band around 3400 cm-1 is often broken down into a number of Gaussian peaks supposedly corresponding to hydrogen-bonded water molecules with different donor (D) and acceptor (A) hydrogen bonds.At 295 K and 0.1 MPa, the Raman spectra of H2O and D2O can be deconvoluted into five sub-bands (see the Raman spectra left, from [2830]), located at 3043, 3225, 3432, 3575, 3638 cm-1 (H2O), or 2265, 2382, 2503, 2590, 2666 cm-1 (D2O), which are assigned to OH (OD) vibrations engaged in DAA, DDAA, DA, DDA hydrogen bonding, and free vibrations [1980, 2894]. It can be seen that the two major vibrations are due to the doubly donor-acceptor or singly donor-acceptor water molecules. Other workers assign different numbers of Gaussian peaks and ascribe them to different causative structures [2972] (see also Methods). Heavy water has also been examined and compared [2972]. D2O shows the prominent presence of the v2 overtone peak that is much weaker in the H2O spectrum.
In liquid water the molecular stretch vibrations shift to higher frequency, on raising the temperature (as hydrogen bonding weakens, the covalent O-H bonds strengthen causing them to vibrate at higher frequencies) whereas the intermolecular vibrations shift to lower frequencies and the molecular bend vibration peak shifts to lower frequencies and becomes both narrower [696] and stronger. These differences between stretch and bend vibrations are due to the increased importance of intermolecular hydrogen bonding at lower temperatures that tends to reduce intermolecular bending whilst encouraging stretching. Thus in the extreme non-hydrogen-bonded state, the 'dangling' O-H bond stretch frequency at surfaces where the water molecule has three hydrogen bonds (two accepting and one donating) is at 3697 cm-1 [1246]. Raising the temperature also lowers the intensity of the stretching bands. This divergent behavior of bending and stretching vibrations allows their contributions to combination bands to be discerned. Thus, combinations of stretching vibrations shift to higher frequency with temperature with this trend reduced when bending vibrations are also combined. As examples, the first overtone combination of symmetric and asymmetric stretching shows a shift from strongly hydrogen-bonded structures (6707 cm-1) to weakly hydrogen-bonded structures (7082 cm-1) with increasing temperature [237], and the combination band at about 5200 cm-1 shifts to slightly higher wavenumbers with reduced hydrogen bond strength [282]. The second overtone of the stretching band gives rise to a significant peak in the near-infrared spectrum (λ 970 nm).
ATR absorption spectra, from [1738]
![ATR absorption spectra, from [1738]](Water%20absorption%20spectrum_files/marechal.gif "ATR absorption spectra, from [1738]")
Increasing the pressure on water decreases the O····O distances (graphed elsewhere) so increasing the covalent O-H distances and lowering their stretch frequency [804]. Raised pressure also causes a reduction in long, weak or broken bonds and an increase in bent and short, strong hydrogen bonds [804].
The overtone bands of water (~1100 nm - 2500 nm, in a scientific discipline known as AquaPhotomics) have been shown to be good discriminatory, and non-destructive, indicators of changes in aqueous structuring in disease diagnosis and protein conformation and have aided the understanding of the role of water in biological systems [1615a]. A database of such interactions is being built up [1615b], with comparisons being made using polar graphs (Aquagrams) [1615c].
The spectra for isotopic variants of water (for example, HDO, D2O and H218O) are all different; in particular the H-O (~3400 cm-1) and D-O (~2500 cm-1) stretching vibrations are not connected in HDO but the related vibrations in H2O and D2O involve both hydrogen atoms.
Wavelength |
cm-1 |
Assignment |
Wavelength** |
cm-1 |
Assignment |
|
|---|---|---|---|---|---|---|
| 0.2 mm | 50 | hydrogen bond bend | 1200 nm | 8330 | av1 + v2 + bv3; a+b=2 | |
| 55 μm | 183.4 | hydrogen bond stretch | 970 nm | 10310 | av1 + bv3; a+b=3 | |
| 25 μm | 395.5 | L1, librations | 836 nm | 11960 | av1 + v2 + bv3; a+b=3 | |
| 15 μm | 686.3 | L2, librations | 739 nm | 13530 | av1 + bv3; a+b=4 | |
| 6.08 μm | 1645 | v2, bend | 660 nm | 15150 | av1 + v2 + bv3; a+b=4 | |
| 4.65 μm | 2150 | v2 + L2 b | 606 nm | 16500 | av1 + bv3; a+b=5 [526] | |
| 3.05 μm | 3277 | v1, symmetric stretch | 514 nm | 19460 | av1 + bv3; a+b=6 [526] | |
| 2.87 μm | 3490 | v3, asymmetric stretch | 449 nm | 22270 | av1 + bv3; a+b=7 [1937] | |
| 1900 nm | 5260 | av1 + v2 + bv3; a+b=1 | 401 nm | 24940 | av1 + bv3; a+b=8 [1937] | |
| 1470 nm | 6800 | av1 + bv3; a+b=2 | Note that a and b
are integers, ≥ 0. |
|||
* Raman peaks are given in [805].
**Wavelength (nm) = 107/wavenumber (cm-1)
(nm ~3.3 attosecond); 1 cm-1 ~ 0.03 THz
The near-infrared (NIR) bands (at about λ 970-1940 nm) are suited to rapid non-destructive water determination
[479], all shifting
a few nm to longer wavelength (lower frequency) with strengthening
hydrogen bonding due to shifts from high-density water (that is, increasing CS) to low-density water (that is, increasing ES) [489]. A
shoulder at about 3250 cm-1 on the side of the
only strongly active Raman peak, and recently described in
the IR spectrum at 3220 cm-1 [699],
(symmetric O-H stretch, v1) of liquid
water has been assigned to the collective in-phase symmetric
O-H vibrations of strongly tetrahedrally-bonded water patches.
The ratio of this to the remaining peak at about 3400 cm-1 has been used to determine the fraction of such water but
such comparisons, although commonly used, should be treated
with caution, as their absorbencies are unlikely to be identical
and other possible vibrations, such as the first bend (v2)
overtone, will interfere. This remaining peak has been analyzed
in many ways (for example, as zero, single, double and triple
coordinated hydrogen-bonded water) but most convincingly in
terms of three-coordinate (double acceptor single donor, 3400
cm-1; single acceptor double donor, 3535 cm-1)
and two-coordinate (single acceptor single donor, 3630 cm-1)
hydrogen-bonded water molecules [699].
There is clearly much structural information hidden in the
vibrational spectra of water, if only it can be unambiguously
interpreted (see methods page).
Some success has recently been made using femtosecond mid-infrared
nonlinear spectroscopy [189, 190] and the theoretical
Raman spectra of water clusters [483]. ![]()
In liquid water and ice, the infrared and Raman spectra are far more complex than the vapor due to vibrational overtones and combinations with librations (restricted rotations; that is, rocking motions). These librations are due to the restrictions imposed by hydrogen bonding (minor L1 band 395.5 cm-1; major L2 band 686.3 cm-1; both for liquid water at 0 °C, the absorbance of L1 increasing with increasing temperature whereas L2 absorbance decreases but broadens with reduced wavenumber with increasing temperature [177]). Ice has a sharper major band at 819 cm-1 (-10 °C) with a minor band at about 510 cm-1 [1219]. The less energetic librations are available to terahertz absorption spectroscopy. The librations depend on the moments of inertia such that the almost doubling of the moments of inertia of D2O, relative to H2O, reduces the frequencies by about a factor of √2. Cluster vibrations such as translational vibrations involve combinations of hydrogen bond O-H····O stretching and bending at around 200 cm-1 (6 THz) [ 240] (S or connectivity band, 183.4 cm-1 (5.5 THz); at 0 °C, the hydrogen bond stretch absorbance increasing with decreasing temperature [819] a; with a major sharp band at 215 cm-1 (6.4 THz) and a minor sharp band at 155 cm-1 (4.6 THz) in ice Ih at -10 °C [1219]. These involve hydrogen-bonded network movements along linear or near-linear hydrogen bonds i and show relatively small differences between H2O and D2O, due to their slightly different masses [1004]. These vibrations around 5 THz (165 cm-1) overlap with the longitudinal acoustic (LA) phonon modes (i.e. hydrogen bond network vib